I Built MenuStat Because Every Mac Monitor Annoyed Me a Little
This started with me opening Activity Monitor too many times a day. The fan would spin up, the Mac would feel a little warm, something would hitch for half a second, and I'd run the same tiny ritual: open Activity Monitor, sort by CPU, glance at memory, close it again. I just wanted that answer sitting in my menu bar.
So I tried a few of the existing apps. They were all fine, which was exactly the problem. One kept the metrics I wanted behind a paid tier. Another threw so many graphs at me that the actual signal got lost. A couple clearly wanted to grow into a full control center for my Mac, when all I needed was to look at it for two seconds and get on with my day.
There was one more thing I cared about. If a tool is going to sit in my menu bar and read system telemetry all day, I want to be able to see exactly what it's doing. For something like this, being able to read the source is the whole basis for trusting it.
Around the same time, I'd been spending a lot of time with Codex. I'm a Codex ambassador, and I wanted to push it on something more real than a demo. A native macOS utility is a great fit for that: the happy path ends fast, and then the genuinely weird stuff starts — AppKit, SwiftUI, Mach counters, IOKit, SMC keys, code signing, notarization, release assets.
So I built MenuStat.
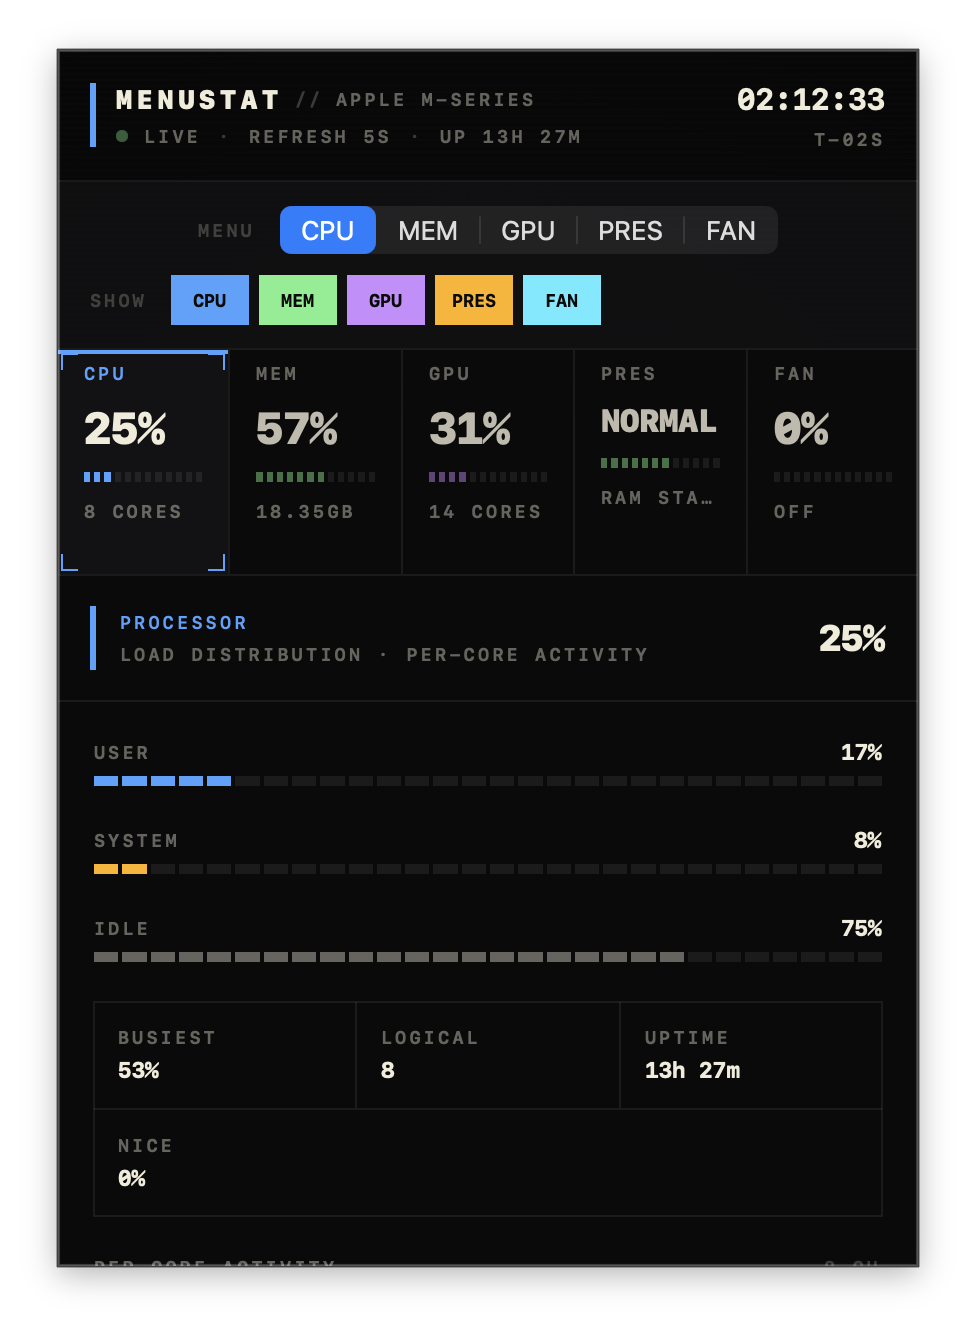
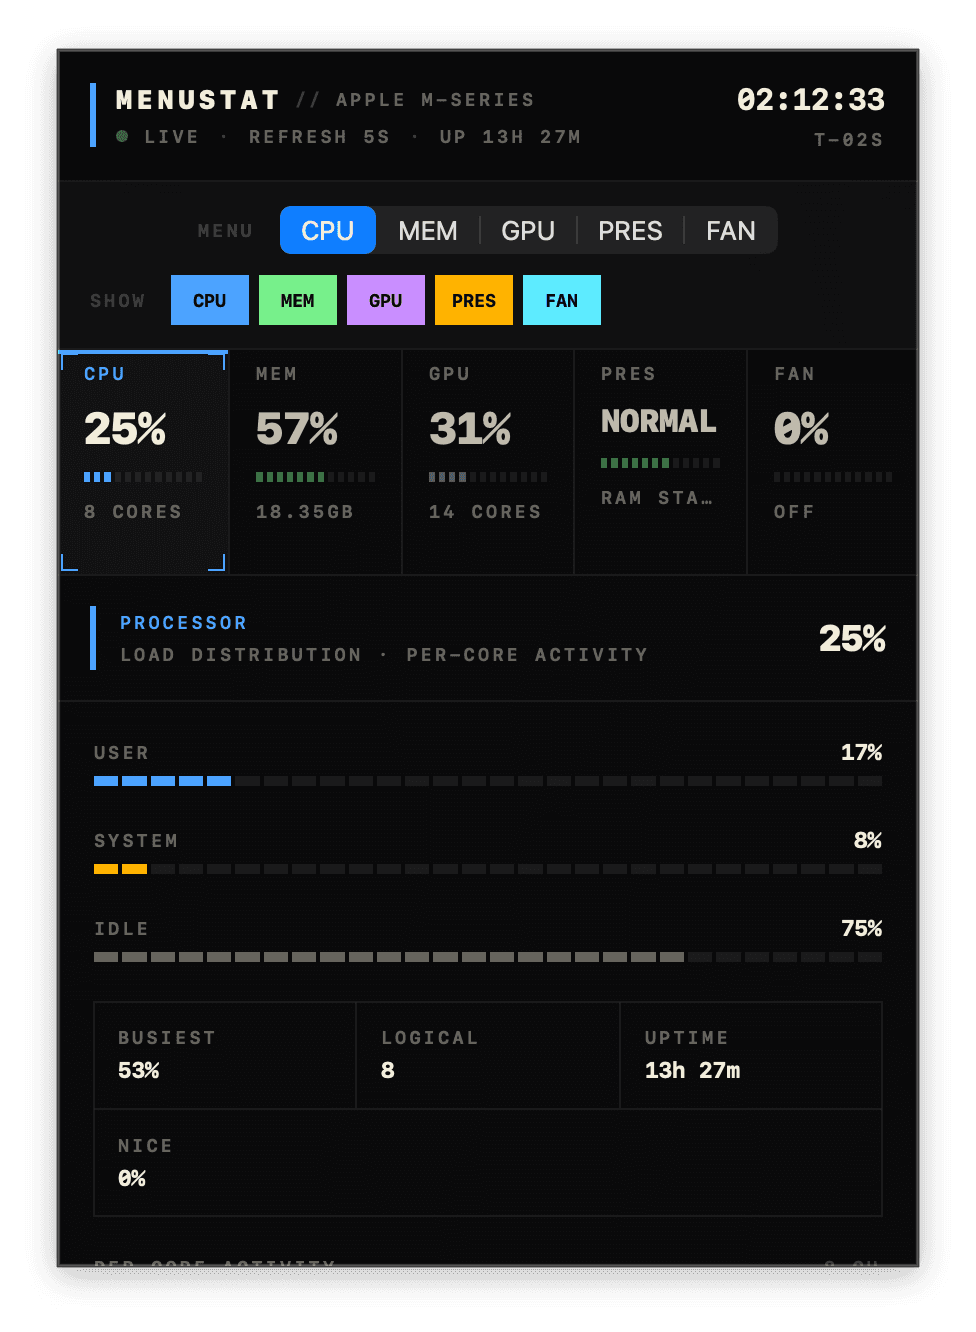
It's a small Apple Silicon menu-bar monitor: CPU, memory, GPU, pressure, fans, and top apps. You click MS, see what the machine is doing, and click away. There's no Dock icon, no account, no cloud sync, and no "optimize your Mac" button.
The first pass got much further than I expected. Codex scaffolded the core shape quickly — a menu-bar app, a SwiftUI panel, real telemetry, packaging scripts, and later a CLI.
But this was not a one-shot "AI built my app" story. I kept asking Codex to make changes, test them, find the next rough edge, and push the fixes. The useful part was not that it produced a perfect first draft. It was that the loop stayed cheap enough for me to keep going: make the panel denser, reduce idle work, fix the launch path, add the CLI, package the release, update the website, verify production, repeat.
The harder part was making it feel like something I'd actually want to leave running all day. That meant cutting background work, fixing numbers that were technically right but confusing in practice, and getting the app quiet enough that it earned its place in the menu bar.
What Guided the Build
One idea shaped most of the app: it should do real work the moment I open it, and stay cheap the rest of the time.
Headline CPU and memory are easy. They can refresh every few seconds because that's cheap enough to run continuously and useful enough to justify it. Per-app process sampling is a different story. Enumerating every PID and calling proc_pidinfo for each one isn't something I wanted happening forever in the background just to keep a hidden panel warm.
So the app only observes. It never kills processes, cleans memory, uploads telemetry, or pretends it knows how to fix your Mac. The CLI follows the same rule — it reads the exact same telemetry as the app, and it has no ability to launch, quit, or configure anything.
The First Architecture
The architecture that kept this manageable is simple: one telemetry core feeding two interfaces.
MenuStatCore
  SystemSampler
  CPU / memory / GPU / fan / app usage snapshots

MenuStat.app
  NSStatusItem
  SwiftUI panel
  5 second refresh loop

menustat
  dashboard
  snapshot
  top
  fans
  JSON output
The SwiftUI panel and the CLI never talk to IOKit or Mach directly. They both consume immutable SystemSnapshot values from the shared core, which made the whole system much easier to reason about — there's a single sampler, and everything else is just a way of rendering its output.
That split also made the work with Codex easier. When I asked for the CLI later, it did not have to invent a second product. It could reuse the existing sampler and render the same snapshot as text instead of as a panel.
Reading the Mac
I could have shelled out to top and parsed its text output. That would have been the easy route, but it felt wrong for an app like this, so MenuStat reads the Mac directly instead.
CPU comes from host_statistics and host_processor_info. The totals are cumulative ticks, so the app stores the previous sample and computes deltas between reads:
let user = cpuTickDelta(current: cpuLoad.cpu_ticks.0, previous: previous.cpu_ticks.0)
let system = cpuTickDelta(current: cpuLoad.cpu_ticks.1, previous: previous.cpu_ticks.1)
let idle = cpuTickDelta(current: cpuLoad.cpu_ticks.2, previous: previous.cpu_ticks.2)
let total = user + system + idle + nice
One small detail bit me early on. CPU ticks can wrap around, and in Swift, plain unsigned subtraction will trap if current < previous. The fix was a one-character change — use the wrapping subtraction operator:
static func cpuTickDelta(current: UInt32, previous: UInt32) -> Double {
    Double(current &- previous)
}
It's a low-probability crash, but a real one, and the patch costs nothing.
Memory comes from host_statistics64. MenuStat breaks the totals out into free, active, inactive, wired, compressed, and speculative pages. "Available" is the slice that's readily reusable:
available = free + inactive + speculative
used = total - available
I'm deliberately not trying to clone Activity Monitor label-for-label here. macOS memory accounting has a lot of opinions baked into it, and what I actually wanted was a stable read on how much memory is available, plus a simple pressure gauge.
Top apps come from libproc — proc_listallpids, proc_pidinfo, and proc_pidpath. The sampler records per-PID CPU time and resident memory, then groups the processes by app name. That grouping is what makes the list readable: when Chrome is eating the machine, I want to see "Chrome" in one row, not five separate helper processes I have to add up in my head.
The 0% CPU Problem
Per-app CPU has an annoying property: it's only meaningful as a delta. To get a number, you need two samples and the time between them:
- What did this PID's CPU time look like a moment ago?
- What does it look like now?
- How much wall-clock time passed between those two reads?
The first version had the kind of bug that's technically correct and still completely unhelpful. I'd open the panel and the top CPU list would show 0% for the first few seconds, because there was no prior sample to diff against yet.
The lazy fix was to keep per-process baselines warm in the background — every 5 seconds, enumerate all PIDs and call proc_pidinfo for each one, even while the panel was hidden. It worked, and it also threw away the entire goal of keeping the app quiet when nobody is looking at it.
The better fix was to take a paired sample on demand. When the panel or status menu opens, the app:
- Captures a process baseline.
- Waits 250ms.
- Captures the visible sample.
That gives the UI a genuinely useful top-app list while keeping the cost where it belongs. The work happens at the moment I ask for detail, and the app sits idle the rest of the time.
The Part After The First Pass
The first pass got the basic product shape right. Everything after that was Codex-assisted iteration: small changes, tests, fixes, release work, and a lot of "this feels off, make it better." Most of that work fell into three buckets:
- Make the numbers honest.
- Keep the app quiet.
- Make shipping it painless.
The low-level details below only matter because they feed into those three goals.
GPU Counters
Apple doesn't expose GPU utilization through any public Swift API, so MenuStat has to go looking for it. It finds the AGXAccelerator service in IORegistry and reads its PerformanceStatistics dictionary. The useful fields are things like:
Device Utilization %Renderer Utilization %Tiler Utilization %In use system memorygpu-core-count
After it discovers the AGX service once, the reader caches it and then prefers targeted property reads over dumping the entire property set on every sample. If the service disappears or stops exposing counters, the app shows an explicit "unavailable" state instead of guessing. These counters go missing or flaky often enough that I'd rather show a blank than a wrong number.
Fans Were Weirder
Fans were the part where it most felt like I was prodding at undocumented internals. The data comes from AppleSMC.
On Apple Silicon, the service you usually want is AppleSMCKeysEndpoint, with AppleSMC as a fallback. MenuStat opens the user client and reads a handful of keys:
FNumfor fan countF0Ac,F1Ac, etc. for current RPMF0Mn,F0Mxfor min/max
The snapshot stores current speeds, min and max speeds, the keys it attempted, and which source service answered. If a Mac has no fans at all, that result gets cached too, so fanless machines don't keep probing SMC on every tick.
The panel turns those raw numbers into something you can read at a glance:
- Off
- Quiet
- Cooling
- High
The actual RPM is still shown underneath. The label is there so I don't have to remember what 3400 RPM is supposed to feel like.
The Panel Had To Stay Out Of The Way
I didn't want the UI to feel like a settings screen.
It's dark, compact, monospaced, and a little instrument-like. CPU is blue, memory is green, GPU is purple, pressure is amber, and fans are cyan.
There are five tiles across the top. Click one, and the detail pane underneath changes:
- CPU split, busiest core, per-core activity, top CPU apps
- Memory breakdown and top memory apps
- GPU renderer/tiler/device utilization
- Pressure state and likely drivers, as a heat proxy
- Fan RPM, range, source, and thermal drivers
The app runs as an LSUIElement, so it has no Dock icon and no normal window. It lives entirely in the menu bar.
That's the whole reason it exists. A window I have to find, focus, and close again is more friction than checking a temperature is worth. The menu bar is always there, so the answer is one click away and then it's gone.
The CLI Became Real
Once the app worked, building a CLI was the obvious next step, since the telemetry core was already sitting there ready to use. It's really just the same core exposed in a form scripts can consume:
menustat
menustat snapshot
menustat snapshot --json
menustat top --by cpu --limit 5
menustat fans
When stdout is a TTY, the CLI shows a live dashboard. When it isn't — piped into another command, say — it falls back to a single plain snapshot and exits. The JSON output uses snake_case keys and raw numeric byte and percent fields, so it's genuinely usable from a script instead of being formatted only for human eyes.
None of this needed a second telemetry implementation. The CLI links MenuStatCore, warms up the sampler the same way the app does, and renders the result as text or JSON.
The Dumb Packaging Bug
This was the dumbest bug in the whole project, and also the most instructive. The release bundle needed two executables side by side:
MenuStat.app/Contents/MacOS/MenuStat
MenuStat.app/Contents/MacOS/menustat
One is the app executable and the other is the embedded CLI, and on disk that looks perfectly reasonable — until you remember that the default macOS volume is case-insensitive. MenuStat and menustat resolve to the same path there, so during packaging one binary quietly overwrote the other. The bundle still looked plausible, the signing mostly looked plausible, and then the app installed from the website DMG just wouldn't launch correctly.
The fix was to rename the internal app executable so the two names no longer collided:
MenuStat.app/Contents/MacOS/MenuStatApp
MenuStat.app/Contents/MacOS/menustat
The bundle is still MenuStat.app, the product is still MenuStat, and the user-facing CLI is still menustat. The only thing that changed is the name of the binary buried inside the bundle.
While I was in there, I tightened up the release script:
- strip
._AppleDouble metadata from zips - build universal app and CLI wrappers
- sign app, embedded CLI, standalone CLI, and DMG
- optionally notarize and staple
- detach stale DMG devices between
hdiutil verifyretries
None of these distribution steps is individually hard. What makes macOS packaging painful is that nearly every step hides one small footgun, and you usually find it only after the artifact is already built and signed. Open source matters here for the same reason it does everywhere else in the project. If I'm asking someone to download a system monitor from my website, they should be able to read the release scripts and the telemetry code and check exactly what's being shipped.
The Website
The website is a small Next.js app living in the same repo. I wanted the page to feel like an extension of the product itself, so it leans on the real panel screenshot, the same telemetry vocabulary, and the same "Apple Silicon required" note that shows up everywhere else.
The download links point at stable GitHub Release aliases:
/releases/latest/download/MenuStat.dmg
/releases/latest/download/MenuStatCLI.zip
Vercel serves the site at:
menustat.adhishthite.vercel.appEven the analytics had a small deployment lesson hiding in it. The package was installed and the code looked correct, but production never served the bootstrap script until I switched to the Next.js-specific entrypoint:
import { Analytics } from "@vercel/analytics/next";After that, I checked the deployed /_vercel/insights/script.js endpoint directly to confirm it was actually live. Having the right code in the repo doesn't tell you much on its own — you have to go look at what's actually running in production.
The CPU Number Question
One question came up almost immediately:
If MenuStat is the top app at 0.4%, why does the system CPU say 17%?
Because those are two different measurements.
The big CPU number is total system CPU load from host statistics. It includes kernel work and every process over the sample window. The top-app list is per-PID CPU deltas grouped by app name, and it only shows the biggest userland contributors the app can actually attribute.
So both readings can be true at once:
- system total:
17% - MenuStat process:
0.4%
The rest comes from kernel work, short-lived processes, timing-window differences, and work spread across many small processes.
The wording in the UI matters here. Labeling the big number SYSTEM TOTAL is clearer than leaving it ambiguous and letting people assume the top-app percentages are supposed to add up to it. This is the kind of rough edge you only notice after living with the app for a while. Each number was already accurate; what it needed was a label that explained how the two relate.
What I Like About It
MenuStat is deliberately small, but building it meant touching a surprising number of layers:
- Mach CPU ticks
- VM page accounting
libprocprocess deltas- AGX IORegistry counters
- AppleSMC fan keys
- AppKit status items
- SwiftUI rendering
- ArgumentParser CLI
- Developer ID signing
- notarization
- DMG packaging
- Vercel distribution
I like that the whole thing is tiny to look at and surprisingly deep underneath. Codex got the first version standing quickly, but the shipped version came from all the follow-up changes I kept asking it to make and push.
These days my menu bar just quietly tells me what my Mac is doing, and most of the time a single click on MS is all I need.